Halyzia® : a powerful quantitative iEEG analyzer for epilepsy


Why Halyzia® ?
Halyzia® helps you analyze iEEG data and provides objective and easily understandable results.
Halyzia® is currently available for research use.
SEAMLESS NAVIGATION
Navigate easily through your data, even if it lasts for hours or contains a large number of channels.
MICRO/MACRO
Read files from micro, macro or synchronized micro and macro-electrode recordings.
QUICK DETECTION OF BIOMARKERS
Easily detect epileptic spikes and high-frequency oscillations (HFOs) such as ripples and fast ripples.
VISUALIZATION OF RESULTS
Review individual events for confidence, view aggregated events on a topographic brain map.
FILE IMPORT
Import your iEEG data in their original format, including heavy files and signal recorded on micro-electrodes at 32 KHz.
EXPORT
Export your metrics in Excel for complementary analyses or research projects.

SUPPORT
We strive to offer fast, caring, and high-quality support.

USER-FRIENDLY
No code needed, intuitive interactions with the software.
LIGHTWEIGHT
Standalone software that runs on your laptop or on a server.
Features
Preprocessing

View the Power Spectral Density (PSD) of the micro and macro-electrodes to check signal quality.
Compare across recordings and patients.
Mark electrodes as bad.
Zoom in, customize subplots, save figures, and more.
Micro and macro channels displayed simultaneously.
Many supported formats: .edf .ncs (Neuralynx) .nsX (1,2,3,4,5,6) .trc (MicroMed), MED, .xls, .csv
Intuitive interaction using the mouse, keyboard shortcuts and global navigation bar.
Monopolar, bipolar, average and median re-referencing.
Easy addition of annotations.
Visual indicators of detected biomarkers.

Poweful Intuitive Viewer

Annotations and notes
Add annotations with a double left click.
Annotate periods and time points easily.
Navigate through annotations.
Export annotations for easy sharing and analysis.
Add notes to highlight specific phases (e.g., sleep, movement).
Quickly label and edit your annotations.
Move annotations across channels as needed.
Work faster with intuitive keyboard shortcuts.

Individual Ripples & Fast Ripples Viewer
The Fast Ripple and Ripple event review windows allow you to easily label and categorize events by confidence level.
Detailed exportable metrics for each detected event, including duration, amplitude, centroid and more.
Multiple signal views to support accurate labelling: raw signal, filtered signal, scalogram, and normalized power spectrum.
Quick actions via shortcuts and mouse control: zoom, hide filters, and more.
Individual Epileptic Spikes Viewer
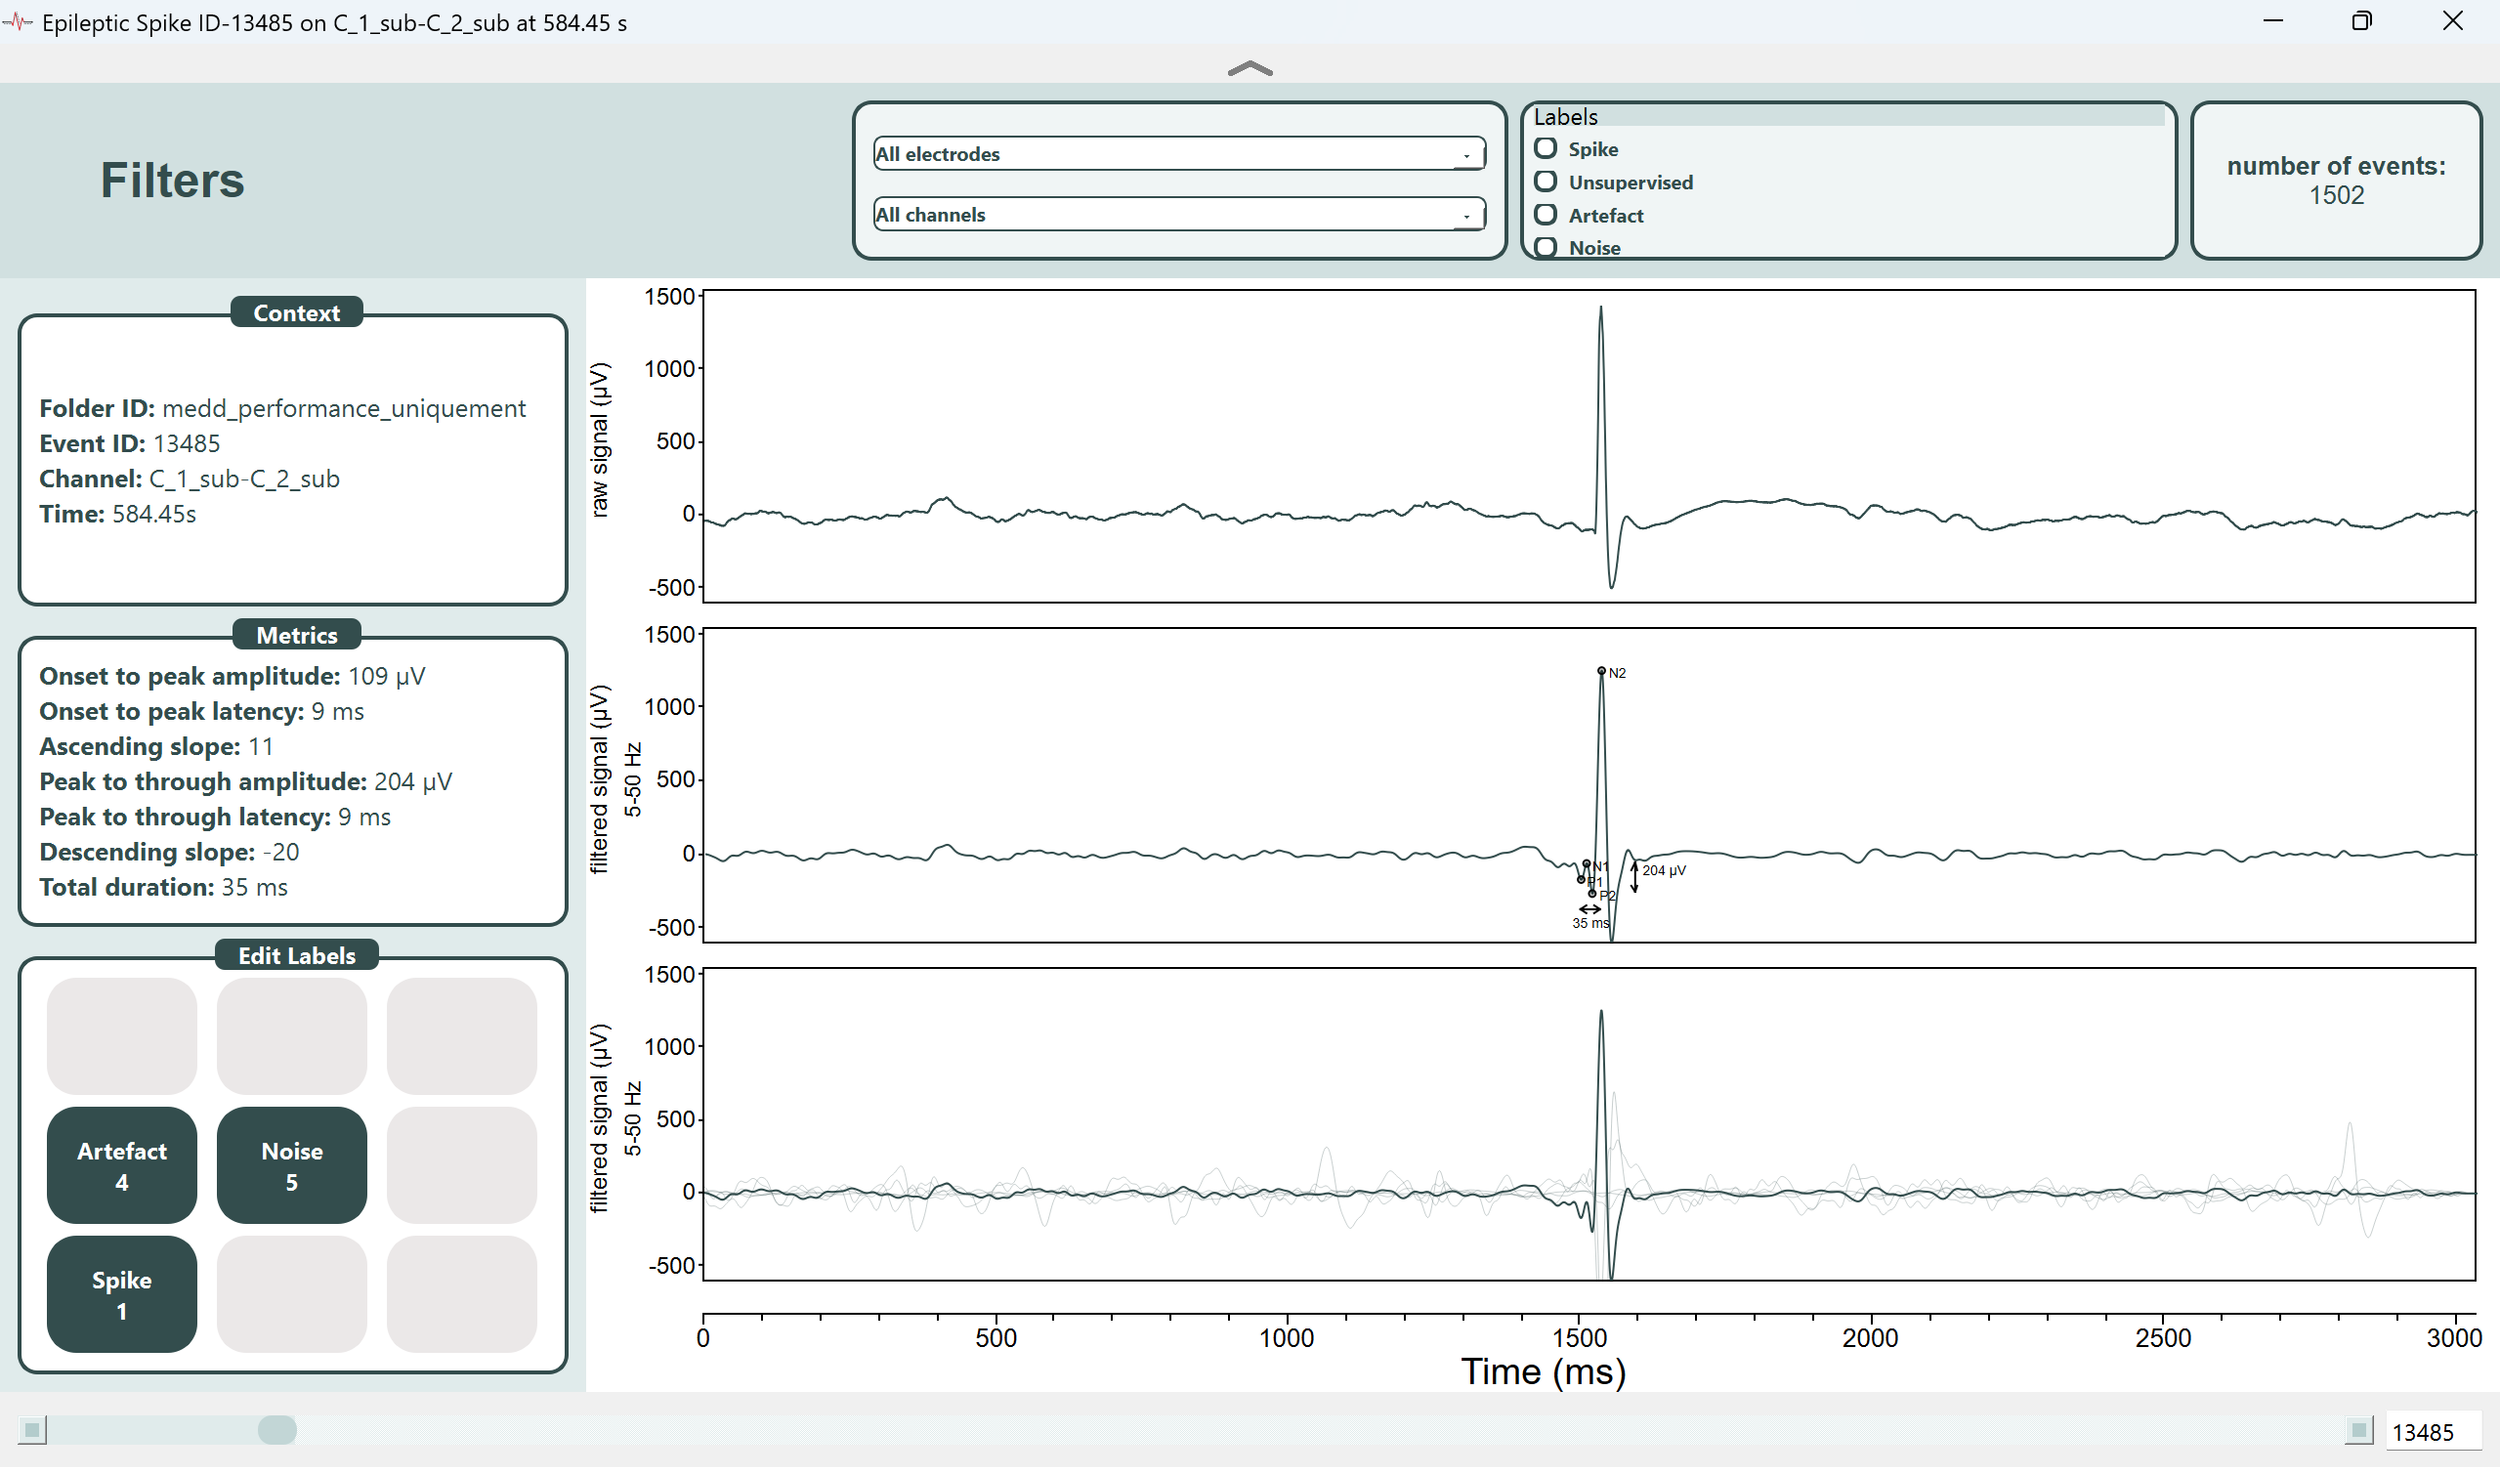
The epileptic spike event review window allows you to confirm or discard events.
Detailed exportable metrics for each detected event, including onset-to-peak amplitude and latency, etc.
Multiple signal views to support accurate labeling: raw signal, filtered signal, and superimposed electrode signals.
Quick actions via shortcuts and mouse controls.
Scalogram on-demand

Visualize an on-demand scalogram for any selected portion of the signal.
Apply filters to refine the signal view.
Zoom in or out on the raw signal for detailed inspection.
Topographic Map

Easily identify the contacts (micro and macro) on which biomarkers of epileptic activity were recorded.
Topographic maps for each type of biomarker: epileptic spikes, ripples and fast ripples.
Combine events to increase specificity!
Label-based filtering for easy navigation.
A panel displaying the temporal distribution of detected events throughout the entire recording.
Intuitive tools for electrode ordering and naming.
Technology behind Halyzia®
Halyzia® integrates WALFRID (Wavelet AnaLysis and IDentification of Fast-Ripples), a new and patented detector, on which Avrio MedTech has exclusive rights.
International patent PCT/EP2022/079304, extended in the US under Patent US 2024/0398319 A1. Detailed information on technology and performance can be found in: Gardy L, Curot J, Valton L, Berthier L, Barbeau EJ, & Hurter C. (2025). Detecting fast-ripples on both micro- and macro-electrodes in epilepsy: A wavelet-based CNN detector. Journal of Neuroscience Methods, 415. https://doi.org/10.1016/j.jneumeth.2024.110350